|
chr9_-_14076901
|
27.281
|
|
NFIB
|
nuclear factor I/B
|
|
chr3_+_161040439
|
16.538
|
|
SCHIP1
|
schwannomin interacting protein 1
|
|
chr3_+_161040343
|
14.821
|
NM_001197109
|
SCHIP1
|
schwannomin interacting protein 1
|
|
chr2_+_101874809
|
13.737
|
|
MAP4K4
|
mitogen-activated protein kinase kinase kinase kinase 4
|
|
chr3_+_160269734
|
13.710
|
NM_001197113
NM_001197114
NM_001042705
NM_001042706
NM_001197100
|
IQCJ-SCHIP1
IQCJ
|
IQCJ-SCHIP1 readthrough
IQ motif containing J
|
|
chr2_+_101874765
|
12.469
|
|
MAP4K4
|
mitogen-activated protein kinase kinase kinase kinase 4
|
|
chrX_+_135079461
|
12.037
|
NM_001167819
|
FHL1
|
four and a half LIM domains 1
|
|
chr12_-_90100710
|
12.009
|
|
DCN
|
decorin
|
|
chr12_-_90100733
|
10.551
|
NM_001920
|
DCN
|
decorin
|
|
chr2_-_215967442
|
10.507
|
|
FN1
|
fibronectin 1
|
|
chr12_-_90100679
|
10.460
|
|
DCN
|
decorin
|
|
chr5_+_71538456
|
10.282
|
|
MAP1B
|
microtubule-associated protein 1B
|
|
chr2_-_215949566
|
10.048
|
|
FN1
|
fibronectin 1
|
|
chr10_-_126706442
|
9.906
|
NM_022802
|
CTBP2
|
C-terminal binding protein 2
|
|
chrX_+_135106578
|
9.882
|
NM_001159701
NM_001159699
|
FHL1
|
four and a half LIM domains 1
|
|
chr13_-_37070862
|
9.367
|
NM_001135934
NM_001135935
NM_001135936
NM_006475
|
POSTN
|
periostin, osteoblast specific factor
|
|
chr9_+_96561750
|
9.364
|
NM_001193329
|
C9orf3
|
chromosome 9 open reading frame 3
|
|
chrX_+_135079120
|
9.244
|
NM_001159704
|
FHL1
|
four and a half LIM domains 1
|
|
chr21_-_26175068
|
8.795
|
|
APP
|
amyloid beta (A4) precursor protein
|
|
chr7_-_41709191
|
8.742
|
NM_002192
|
INHBA
|
inhibin, beta A
|
|
chr3_+_158637273
|
8.630
|
NM_002852
|
PTX3
|
pentraxin 3, long
|
|
chr7_-_27171648
|
8.496
|
|
HOXA9
|
homeobox A9
|
|
chr7_-_27171673
|
8.223
|
NM_152739
|
HOXA9
|
homeobox A9
|
|
chr5_-_168204430
|
7.618
|
|
|
|
|
chr1_-_20682541
|
7.600
|
|
|
|
|
chr8_-_122722674
|
7.494
|
NM_005328
|
HAS2
|
hyaluronan synthase 2
|
|
chr1_+_181380837
|
7.434
|
|
LAMC1
|
laminin, gamma 1 (formerly LAMB2)
|
|
chr4_+_169654742
|
7.043
|
NM_001166108
NM_016081
|
PALLD
|
palladin, cytoskeletal associated protein
|
|
chr22_-_34566367
|
6.914
|
NM_001031695
NM_001082576
NM_001082577
NM_014309
|
RBFOX2
|
RNA binding protein, fox-1 homolog (C. elegans) 2
|
|
chr3_-_150578148
|
6.833
|
|
TM4SF1
|
transmembrane 4 L six family member 1
|
|
chr10_+_63331018
|
6.820
|
NM_032199
|
ARID5B
|
AT rich interactive domain 5B (MRF1-like)
|
|
chr3_-_150578207
|
6.704
|
NM_014220
|
TM4SF1
|
transmembrane 4 L six family member 1
|
|
chr2_-_190635566
|
6.667
|
NM_005259
|
MSTN
|
myostatin
|
|
chr22_-_34566276
|
6.584
|
|
RBFOX2
|
RNA binding protein, fox-1 homolog (C. elegans) 2
|
|
chr3_-_150578103
|
6.568
|
|
TM4SF1
|
transmembrane 4 L six family member 1
|
|
chr22_-_34566210
|
6.485
|
|
RBFOX2
|
RNA binding protein, fox-1 homolog (C. elegans) 2
|
|
chr7_+_134114701
|
6.470
|
NM_004342
NM_033138
NM_033157
|
CALD1
|
caldesmon 1
|
|
chr11_-_27698800
|
6.340
|
NM_001143805
NM_001143806
NM_170732
|
BDNF
|
brain-derived neurotrophic factor
|
|
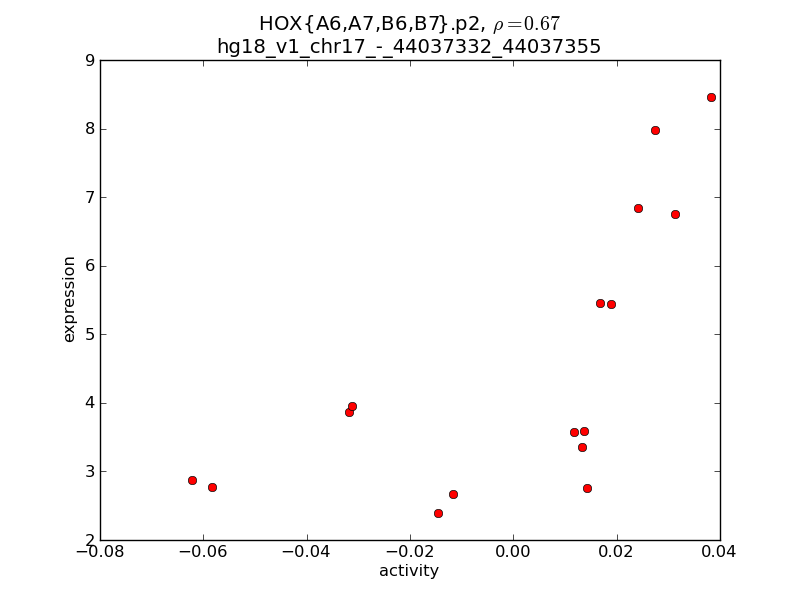
chr17_-_44037332
|
6.264
|
NM_018952
|
HOXB6
|
homeobox B6
|
|
chr11_+_101488380
|
6.206
|
NM_001195045
|
YAP1
|
Yes-associated protein 1
|
|
chr1_+_81544432
|
6.090
|
|
LPHN2
|
latrophilin 2
|
|
chr7_+_134114957
|
5.974
|
|
CALD1
|
caldesmon 1
|
|
chr6_+_121798443
|
5.968
|
NM_000165
|
GJA1
|
gap junction protein, alpha 1, 43kDa
|
|
chr13_-_43908937
|
5.883
|
|
TSC22D1
|
TSC22 domain family, member 1
|
|
chr1_+_84402962
|
5.881
|
|
PRKACB
|
protein kinase, cAMP-dependent, catalytic, beta
|
|
chr7_-_27149750
|
5.655
|
NM_019102
|
HOXA5
|
homeobox A5
|
|
chr5_+_34723420
|
5.631
|
NM_001145523
|
RAI14
|
retinoic acid induced 14
|
|
chrX_-_10495476
|
5.556
|
NM_001193278
NM_001193279
NM_001193280
NM_001193281
|
MID1
|
midline 1 (Opitz/BBB syndrome)
|
|
chr3_+_137224266
|
5.524
|
NM_181897
|
PPP2R3A
|
protein phosphatase 2, regulatory subunit B'', alpha
|
|
chr11_-_27679617
|
5.468
|
NM_170733
|
BDNF
|
brain-derived neurotrophic factor
|
|
chr7_+_134226727
|
5.372
|
|
CALD1
|
caldesmon 1
|
|
chr2_-_189752575
|
5.338
|
NM_000393
|
COL5A2
|
collagen, type V, alpha 2
|
|
chr3_-_115960807
|
5.283
|
NM_001164344
NM_001164345
|
ZBTB20
|
zinc finger and BTB domain containing 20
|
|
chr7_+_102340579
|
5.200
|
NM_001031692
NM_005824
|
LRRC17
|
leucine rich repeat containing 17
|
|
chr7_+_134226690
|
5.031
|
NM_033139
NM_033140
|
CALD1
|
caldesmon 1
|
|
chr2_+_66516196
|
5.016
|
|
MEIS1
|
Meis homeobox 1
|
|
chr18_+_59705918
|
4.949
|
NM_001143818
NM_002575
|
SERPINB2
|
serpin peptidase inhibitor, clade B (ovalbumin), member 2
|
|
chr11_+_69176391
|
4.946
|
|
CCND1
|
cyclin D1
|
|
chr9_-_116920232
|
4.939
|
NM_002160
|
TNC
|
tenascin C
|
|
chr12_-_88270128
|
4.927
|
|
DUSP6
|
dual specificity phosphatase 6
|
|
chr2_-_151052391
|
4.919
|
NM_005168
|
RND3
|
Rho family GTPase 3
|
|
chr12_-_48902692
|
4.900
|
NM_001113547
|
LIMA1
|
LIM domain and actin binding 1
|
|
chr3_-_55490401
|
4.873
|
|
WNT5A
|
wingless-type MMTV integration site family, member 5A
|
|
chr5_-_39430180
|
4.857
|
|
DAB2
|
disabled homolog 2, mitogen-responsive phosphoprotein (Drosophila)
|
|
chr11_+_130745580
|
4.807
|
NM_001048209
|
NTM
|
neurotrimin
|
|
chr2_+_170074457
|
4.708
|
NM_006063
|
KBTBD10
|
kelch repeat and BTB (POZ) domain containing 10
|
|
chr19_-_54835162
|
4.702
|
NM_006270
|
RRAS
|
related RAS viral (r-ras) oncogene homolog
|
|
chr2_-_55090759
|
4.695
|
NM_007008
|
RTN4
|
reticulon 4
|
|
chr3_-_150578023
|
4.660
|
|
TM4SF1
|
transmembrane 4 L six family member 1
|
|
chr4_+_54790020
|
4.650
|
NM_006206
|
PDGFRA
|
platelet-derived growth factor receptor, alpha polypeptide
|
|
chr11_-_114593838
|
4.536
|
|
CADM1
|
cell adhesion molecule 1
|
|
chr6_-_169395972
|
4.479
|
NM_003247
|
THBS2
|
thrombospondin 2
|
|
chr12_-_88270375
|
4.445
|
NM_001946
NM_022652
|
DUSP6
|
dual specificity phosphatase 6
|
|
chr10_-_92671005
|
4.148
|
NM_014391
|
ANKRD1
|
ankyrin repeat domain 1 (cardiac muscle)
|
|
chr8_+_9990471
|
4.102
|
NM_001135671
|
MSRA
|
methionine sulfoxide reductase A
|
|
chr2_+_33213111
|
4.035
|
NM_000627
NM_001166264
NM_001166265
NM_001166266
|
LTBP1
|
latent transforming growth factor beta binding protein 1
|
|
chr3_-_124821868
|
3.962
|
|
MYLK
|
myosin light chain kinase
|
|
chrX_+_135058402
|
3.950
|
NM_001159700
|
FHL1
|
four and a half LIM domains 1
|
|
chr1_+_78243181
|
3.852
|
NM_007034
|
DNAJB4
|
DnaJ (Hsp40) homolog, subfamily B, member 4
|
|
chr1_-_85816520
|
3.790
|
NM_001134445
|
DDAH1
|
dimethylarginine dimethylaminohydrolase 1
|
|
chr9_-_13240313
|
3.758
|
NM_003829
|
MPDZ
|
multiple PDZ domain protein
|
|
chr6_+_83129641
|
3.731
|
NM_006670
|
TPBG
|
trophoblast glycoprotein
|
|
chr15_+_94670160
|
3.678
|
NM_001145155
|
NR2F2
|
nuclear receptor subfamily 2, group F, member 2
|
|
chr5_+_140751666
|
3.667
|
NM_014004
NM_032088
|
PCDHGA8
|
protocadherin gamma subfamily A, 8
|
|
chr13_-_109600709
|
3.650
|
|
COL4A1
|
collagen, type IV, alpha 1
|
|
chr8_+_32623792
|
3.629
|
NM_013959
|
NRG1
|
neuregulin 1
|
|
chr5_-_111119846
|
3.614
|
NM_001142483
|
C5orf13
|
chromosome 5 open reading frame 13
|
|
chr9_-_14388981
|
3.561
|
NM_001190738
|
NFIB
|
nuclear factor I/B
|
|
chr1_+_149299504
|
3.559
|
|
MLLT11
|
myeloid/lymphoid or mixed-lineage leukemia (trithorax homolog, Drosophila); translocated to, 11
|
|
chr3_-_188935363
|
3.551
|
NM_001134738
|
BCL6
|
B-cell CLL/lymphoma 6
|
|
chr4_-_40631397
|
3.497
|
|
APBB2
|
amyloid beta (A4) precursor protein-binding, family B, member 2
|
|
chr8_+_70541412
|
3.445
|
NM_001128204
NM_015170
|
SULF1
|
sulfatase 1
|
|
chr1_+_149299490
|
3.441
|
|
MLLT11
|
myeloid/lymphoid or mixed-lineage leukemia (trithorax homolog, Drosophila); translocated to, 11
|
|
chr12_-_88270369
|
3.437
|
|
DUSP6
|
dual specificity phosphatase 6
|
|
chr2_-_55053398
|
3.395
|
|
|
|
|
chrX_-_10605726
|
3.383
|
NM_001098624
|
MID1
|
midline 1 (Opitz/BBB syndrome)
|
|
chr8_-_49996353
|
3.343
|
NM_003068
|
SNAI2
|
snail homolog 2 (Drosophila)
|
|
chr5_-_121441910
|
3.243
|
NM_002317
|
LOX
|
lysyl oxidase
|
|
chr7_-_107667728
|
3.240
|
NM_001037132
|
NRCAM
|
neuronal cell adhesion molecule
|
|
chr20_+_19818209
|
3.215
|
NM_018993
|
RIN2
|
Ras and Rab interactor 2
|
|
chr13_+_100902942
|
3.178
|
NM_004791
|
ITGBL1
|
integrin, beta-like 1 (with EGF-like repeat domains)
|
|
chr8_-_18710575
|
3.165
|
NM_206909
|
PSD3
|
pleckstrin and Sec7 domain containing 3
|
|
chr9_+_74956614
|
3.162
|
|
ANXA1
|
annexin A1
|
|
chr3_-_116272911
|
3.148
|
NM_001164343
|
ZBTB20
|
zinc finger and BTB domain containing 20
|
|
chr12_-_103846186
|
3.147
|
NM_032148
|
SLC41A2
|
solute carrier family 41, member 2
|
|
chr4_+_41309668
|
3.145
|
NM_001112719
NM_001112720
|
LIMCH1
|
LIM and calponin homology domains 1
|
|
chr2_+_66516020
|
3.123
|
NM_002398
|
MEIS1
|
Meis homeobox 1
|
|
chrX_+_114734074
|
3.066
|
NM_001136025
NM_001172335
|
PLS3
|
plastin 3
|
|
chr5_+_125723686
|
3.055
|
NM_001146319
|
GRAMD3
|
GRAM domain containing 3
|
|
chrX_-_10761729
|
3.030
|
NM_033290
|
MID1
|
midline 1 (Opitz/BBB syndrome)
|
|
chrX_-_10504852
|
3.028
|
NM_001193277
|
MID1
|
midline 1 (Opitz/BBB syndrome)
|
|
chr4_+_41395493
|
3.017
|
|
LIMCH1
|
LIM and calponin homology domains 1
|
|
chr8_+_70567581
|
2.994
|
NM_001128205
NM_001128206
|
SULF1
|
sulfatase 1
|
|
chr6_+_143971009
|
2.973
|
NM_001100166
NM_014721
|
PHACTR2
|
phosphatase and actin regulator 2
|
|
chr8_-_93176618
|
2.964
|
NM_001198629
NM_001198630
NM_001198632
NM_175635
|
RUNX1T1
|
runt-related transcription factor 1; translocated to, 1 (cyclin D-related)
|
|
chr1_-_191422346
|
2.920
|
NM_003783
|
B3GALT2
|
UDP-Gal:betaGlcNAc beta 1,3-galactosyltransferase, polypeptide 2
|
|
chr7_-_107430566
|
2.849
|
NM_002291
|
LAMB1
|
laminin, beta 1
|
|
chr1_+_149299530
|
2.832
|
|
MLLT11
|
myeloid/lymphoid or mixed-lineage leukemia (trithorax homolog, Drosophila); translocated to, 11
|
|
chr5_-_39460687
|
2.828
|
|
DAB2
|
disabled homolog 2, mitogen-responsive phosphoprotein (Drosophila)
|
|
chr7_+_134114912
|
2.766
|
|
CALD1
|
caldesmon 1
|
|
chr6_-_169395847
|
2.761
|
|
THBS2
|
thrombospondin 2
|
|
chr17_-_43977273
|
2.755
|
NM_002145
|
HOXB2
|
homeobox B2
|
|
chr3_+_35696119
|
2.751
|
NM_001025068
NM_001025069
|
ARPP21
|
cAMP-regulated phosphoprotein, 21kDa
|
|
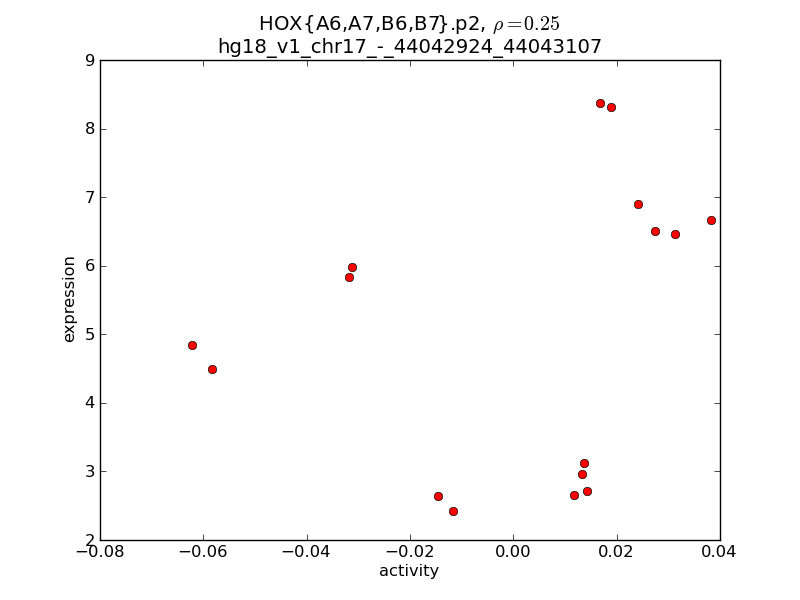
chr17_-_44042924
|
2.736
|
|
HOXB7
|
homeobox B7
|
|
chr3_-_79899748
|
2.729
|
NM_002941
|
ROBO1
|
roundabout, axon guidance receptor, homolog 1 (Drosophila)
|
|
chr8_+_70567634
|
2.728
|
|
SULF1
|
sulfatase 1
|
|
chr6_+_21701942
|
2.720
|
NM_003107
|
SOX4
|
SRY (sex determining region Y)-box 4
|
|
chr20_+_11846536
|
2.659
|
NM_014962
|
BTBD3
|
BTB (POZ) domain containing 3
|
|
chr12_-_51298599
|
2.652
|
NM_175068
|
KRT73
|
keratin 73
|
|
chr1_-_56817823
|
2.636
|
NM_003713
|
PPAP2B
|
phosphatidic acid phosphatase type 2B
|
|
chr10_-_29963906
|
2.633
|
NM_021738
|
SVIL
|
supervillin
|
|
chr11_-_27679175
|
2.633
|
NM_001143808
NM_001143809
NM_001143810
NM_001143811
|
BDNF
|
brain-derived neurotrophic factor
|
|
chr1_+_149299307
|
2.628
|
|
MLLT11
|
myeloid/lymphoid or mixed-lineage leukemia (trithorax homolog, Drosophila); translocated to, 11
|
|
chr1_+_84382529
|
2.575
|
NM_182948
|
PRKACB
|
protein kinase, cAMP-dependent, catalytic, beta
|
|
chr6_-_134540666
|
2.570
|
NM_001143677
|
SGK1
|
serum/glucocorticoid regulated kinase 1
|
|
chr2_-_210888010
|
2.565
|
NM_079420
|
MYL1
|
myosin, light chain 1, alkali; skeletal, fast
|
|
chrX_-_13745108
|
2.555
|
|
GPM6B
|
glycoprotein M6B
|
|
chr8_+_26569709
|
2.554
|
|
DPYSL2
|
dihydropyrimidinase-like 2
|
|
chrX_-_13744933
|
2.551
|
|
GPM6B
|
glycoprotein M6B
|
|
chr20_+_9406460
|
2.528
|
|
PLCB4
|
phospholipase C, beta 4
|
|
chr17_+_39990124
|
2.519
|
NM_001466
|
FZD2
|
frizzled homolog 2 (Drosophila)
|
|
chr15_+_94677572
|
2.510
|
NM_001145157
|
NR2F2
|
nuclear receptor subfamily 2, group F, member 2
|
|
chr5_+_140742585
|
2.503
|
NM_018920
NM_032087
|
PCDHGA7
|
protocadherin gamma subfamily A, 7
|
|
chr17_-_44026321
|
2.502
|
|
HOXB5
|
homeobox B5
|
|
chr5_+_140723939
|
2.485
|
NM_018918
NM_032054
|
PCDHGA5
|
protocadherin gamma subfamily A, 5
|
|
chr8_-_18585721
|
2.465
|
|
PSD3
|
pleckstrin and Sec7 domain containing 3
|
|
chr7_+_18501876
|
2.458
|
NM_014707
NM_178423
|
HDAC9
|
histone deacetylase 9
|
|
chr3_-_115825742
|
2.454
|
NM_001164347
|
ZBTB20
|
zinc finger and BTB domain containing 20
|
|
chr6_+_151688327
|
2.441
|
NM_144497
|
AKAP12
|
A kinase (PRKA) anchor protein 12
|
|
chr3_-_188946168
|
2.429
|
NM_001706
|
BCL6
|
B-cell CLL/lymphoma 6
|
|
chr12_-_28016182
|
2.415
|
NM_002820
NM_198965
|
PTHLH
|
parathyroid hormone-like hormone
|
|
chr5_+_155686333
|
2.391
|
NM_000337
NM_001128209
NM_172244
|
SGCD
|
sarcoglycan, delta (35kDa dystrophin-associated glycoprotein)
|
|
chr2_-_144994038
|
2.381
|
|
ZEB2
|
zinc finger E-box binding homeobox 2
|
|
chr5_+_36642424
|
2.376
|
|
SLC1A3
|
solute carrier family 1 (glial high affinity glutamate transporter), member 3
|
|
chr8_-_131483395
|
2.369
|
NM_018482
|
ASAP1
|
ArfGAP with SH3 domain, ankyrin repeat and PH domain 1
|
|
chr9_-_14304036
|
2.364
|
NM_001190737
NM_005596
|
NFIB
|
nuclear factor I/B
|
|
chr12_+_52708460
|
2.345
|
NM_004503
|
HOXC6
|
homeobox C6
|
|
chr4_-_91979113
|
2.337
|
NM_183049
|
TMSL3
|
thymosin-like 3
|
|
chr5_+_34720368
|
2.327
|
NM_001145521
NM_001145525
|
RAI14
|
retinoic acid induced 14
|
|
chr7_-_83662152
|
2.321
|
NM_006080
|
SEMA3A
|
sema domain, immunoglobulin domain (Ig), short basic domain, secreted, (semaphorin) 3A
|
|
chr1_-_56817802
|
2.317
|
|
PPAP2B
|
phosphatidic acid phosphatase type 2B
|
|
chr4_-_187114863
|
2.315
|
NM_021069
|
SORBS2
|
sorbin and SH3 domain containing 2
|
|
chr18_+_71051713
|
2.314
|
NM_005786
|
TSHZ1
|
teashirt zinc finger homeobox 1
|
|
chr20_-_14266200
|
2.312
|
NM_013281
NM_198391
|
FLRT3
|
fibronectin leucine rich transmembrane protein 3
|
|
chr1_+_99884018
|
2.307
|
NM_017734
|
PALMD
|
palmdelphin
|
|
chr12_+_79625538
|
2.300
|
NM_002469
|
MYF6
|
myogenic factor 6 (herculin)
|
|
chr10_+_17310263
|
2.296
|
NM_003380
|
VIM
|
vimentin
|
|
chr12_+_52696908
|
2.281
|
NM_014620
NM_153693
|
HOXC4
HOXC6
|
homeobox C4
homeobox C6
|
|
chr16_+_81218074
|
2.277
|
NM_001257
|
CDH13
|
cadherin 13, H-cadherin (heart)
|
|
chr17_-_36928604
|
2.270
|
NM_002275
|
KRT15
|
keratin 15
|
|
chr12_+_118100977
|
2.268
|
NM_014365
|
HSPB8
|
heat shock 22kDa protein 8
|
|
chr14_+_100365390
|
2.260
|
|
MEG3
|
maternally expressed 3 (non-protein coding)
|
|
chr21_+_39117064
|
2.254
|
|
ETS2
|
v-ets erythroblastosis virus E26 oncogene homolog 2 (avian)
|
|
chr9_-_94284455
|
2.248
|
|
ASPN
|
asporin
|
|
chr5_+_36642213
|
2.243
|
NM_001166696
NM_004172
|
SLC1A3
|
solute carrier family 1 (glial high affinity glutamate transporter), member 3
|
|
chr10_-_33663305
|
2.233
|
|
NRP1
|
neuropilin 1
|
|
chr21_+_29439768
|
2.232
|
|
C21orf7
|
chromosome 21 open reading frame 7
|
|
chr7_-_30032649
|
2.217
|
NM_017946
|
FKBP14
|
FK506 binding protein 14, 22 kDa
|
|
chr17_-_44026042
|
2.201
|
NM_002147
|
HOXB5
|
homeobox B5
|
|
chr1_-_56817568
|
2.169
|
|
PPAP2B
|
phosphatidic acid phosphatase type 2B
|
|
chr4_+_169250281
|
2.145
|
NM_007193
|
ANXA10
|
annexin A10
|
|
chr21_-_38792173
|
2.133
|
NM_001136155
NM_182918
|
ERG
|
v-ets erythroblastosis virus E26 oncogene homolog (avian)
|
|
chr1_-_42738535
|
2.129
|
|
TMSB4XP1
|
thymosin beta 4, X-linked pseudogene 1
|
|
chr8_-_102005697
|
2.124
|
|
YWHAZ
|
tyrosine 3-monooxygenase/tryptophan 5-monooxygenase activation protein, zeta polypeptide
|
|
chr9_-_94284571
|
2.121
|
NM_001193335
NM_017680
|
ASPN
|
asporin
|
|
chr2_-_168812132
|
2.100
|
NM_013233
|
STK39
|
serine threonine kinase 39
|
|
chr5_+_125786975
|
2.098
|
|
GRAMD3
|
GRAM domain containing 3
|
|
chr1_+_114323552
|
2.086
|
NM_020190
|
OLFML3
|
olfactomedin-like 3
|
|
chr16_+_7322751
|
2.082
|
NM_145891
NM_145892
NM_145893
|
RBFOX1
|
RNA binding protein, fox-1 homolog (C. elegans) 1
|
|
chr1_-_56817717
|
2.074
|
|
PPAP2B
|
phosphatidic acid phosphatase type 2B
|
|
chr5_+_125786717
|
2.065
|
NM_001146320
NM_001146321
NM_023927
|
GRAMD3
|
GRAM domain containing 3
|
|
chr18_+_3437607
|
2.059
|
NM_173207
|
TGIF1
|
TGFB-induced factor homeobox 1
|
|
chr3_-_101316038
|
2.053
|
NM_001042459
NM_182909
|
FILIP1L
|
filamin A interacting protein 1-like
|
|
chr18_+_31488530
|
2.014
|
NM_020474
|
GALNT1
|
UDP-N-acetyl-alpha-D-galactosamine:polypeptide N-acetylgalactosaminyltransferase 1 (GalNAc-T1)
|
|
chr6_-_116553918
|
2.013
|
NM_000493
|
COL10A1
|
collagen, type X, alpha 1
|
|
chr9_-_74735669
|
1.999
|
|
ALDH1A1
|
aldehyde dehydrogenase 1 family, member A1
|
|
chr6_+_158653679
|
1.984
|
NM_001007466
NM_020245
|
TULP4
|
tubby like protein 4
|
|
chr10_+_86121526
|
1.978
|
|
FAM190B
|
family with sequence similarity 190, member B
|
|
chr14_-_91483325
|
1.968
|
|
FBLN5
|
fibulin 5
|
|
chr10_-_92670764
|
1.955
|
|
ANKRD1
|
ankyrin repeat domain 1 (cardiac muscle)
|